The JMeter is desktop/ command line Java application designed to load test functional behavior and measure performance. It was originally designed for testing Web Applications.
This article shows how to use it for testing webapps.
Preparations
- Install JMeter on your laptop. On Linux is as package in some central repositories.
- Install htop on your server. htop is top on steroids. You can find it on rpmforge repos.
Getting Started
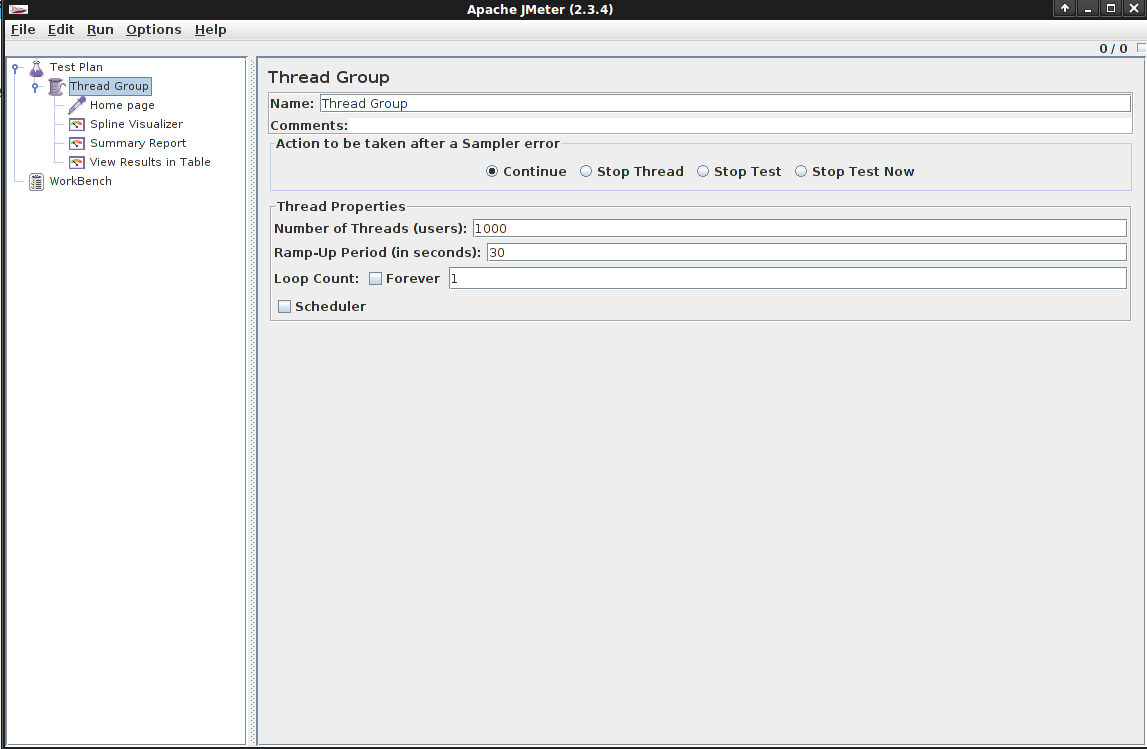
It shows how to define basic request for server and dump reports.1. Adding Thread Group to Test Plan
- Number of Threads: Defines how many threads (users) will access to the server.
- RampUp Period: In what time period the requests shall be made. Zero means immediately.

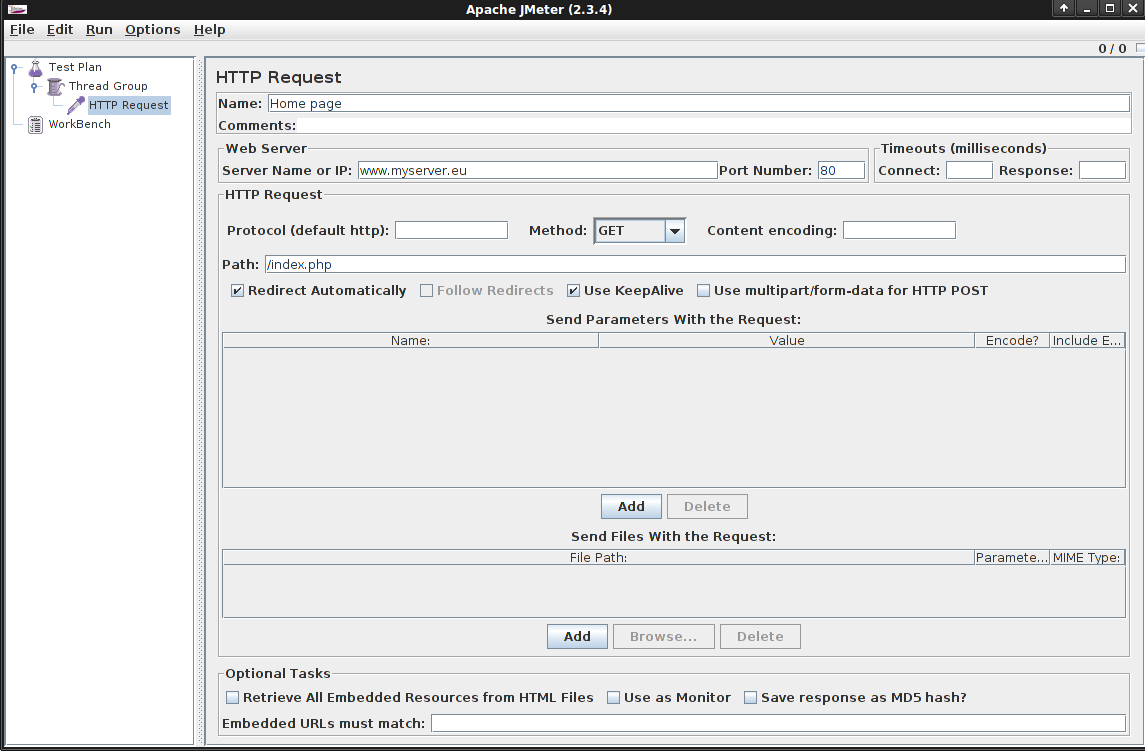
2. Adding Reguest to Thread Group
Type in the Server name, Port number, Path.
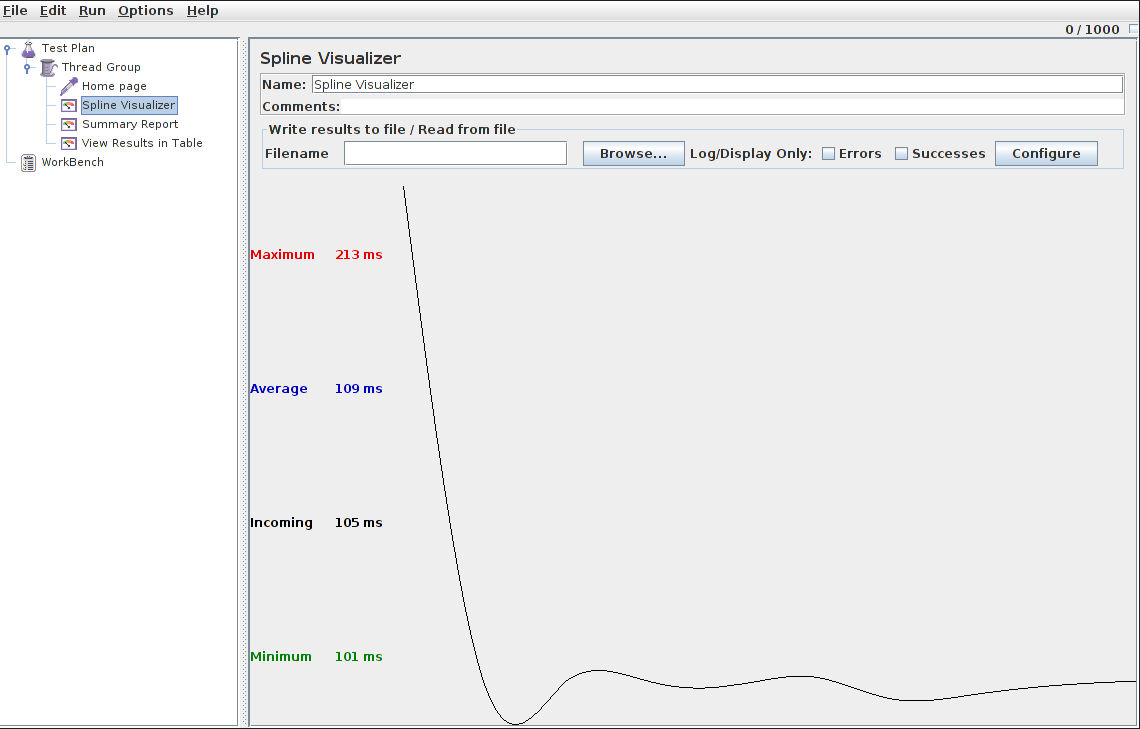
3. Adding Listeners to Thread Group
Listeners used to capture and presentation of results.
For example: Spline Visualizer, Summary Report, View Requests in Table.
4. Starting basic test.
Go to server and run htop for watching server status dynamically. You can see: CPU and memory usage, Swap usage, processes, …

From JMeter main menu Run>Start. During testing watch the behavior of the server on htop console. It may help to understand more your server.
After completing the test explore results in Listeners sections: errors, times, responses,...
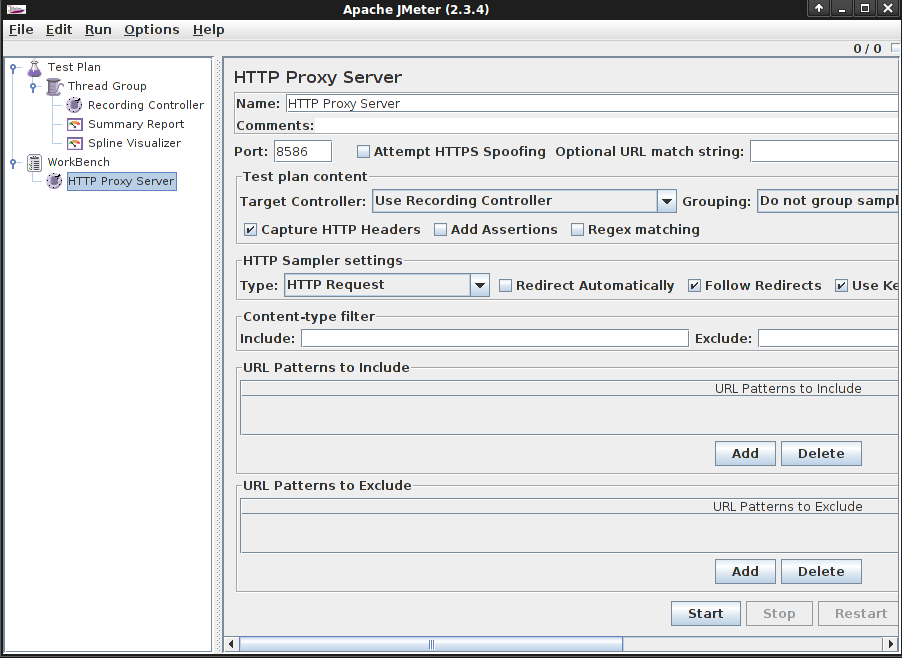
Using proxy server for recording complex requests
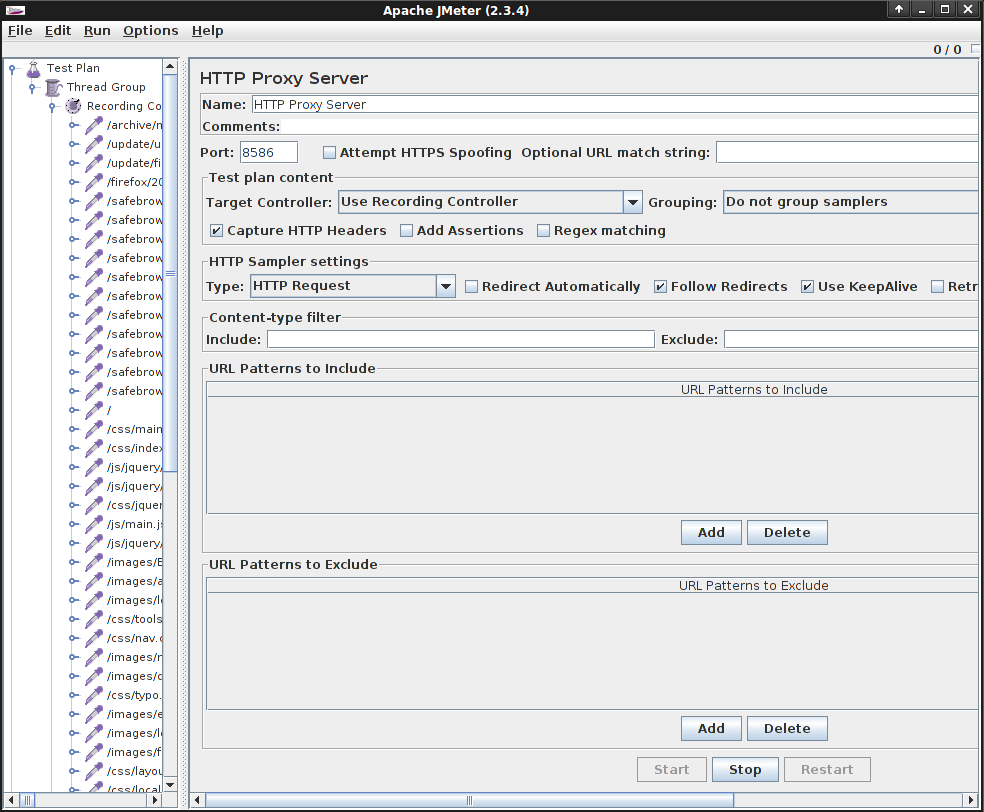
For a definition of complex requests is best to use the HTTP Proxy Server.
- Insert HTTP Proxy Server component to WorkBench fork. Define port and click to Start button.
- Insert Recording Controller to Thread Group.
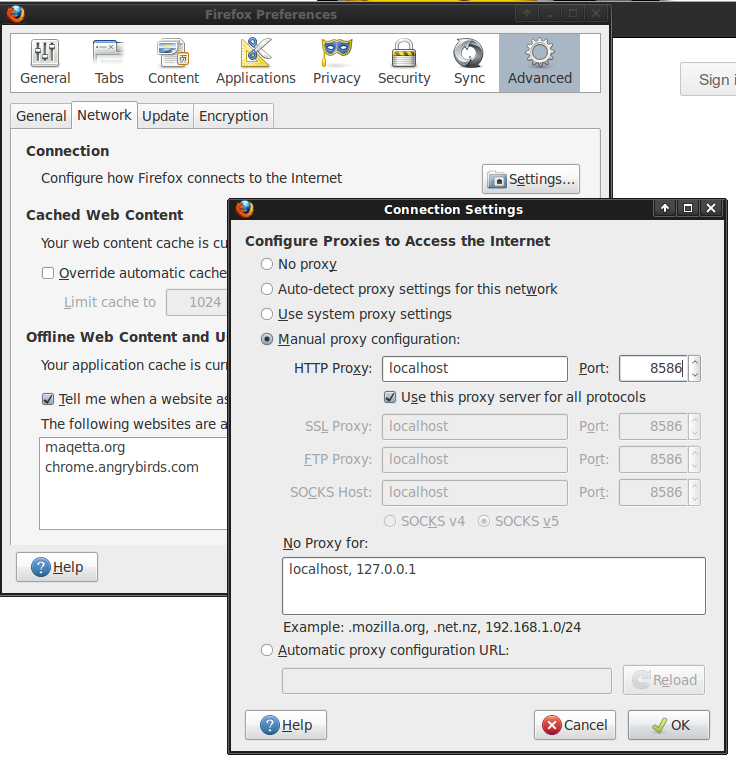
Connecting to HTTP Proxy Server
Go into the settings of your favorite web browser and connect to the proxy server.
Now, in your web browser go to your webapp and make requests. For example fill out and submit the form. All your requests are stored in the Record Conroller.
At the end don´t forget stop the HTTP Proxy server. Start test and watch results.
Conclusion
JMeter offers a lot of others components: Timers, Logic Controllers, Assertions for checking responses. You can test SOAP and XML/RPC services, JDBC connections, FTP requests.JMeter can be run from the command line. You can test automatically from scripts, or on server without GUI.